banner_market_intelligence_1440x441

MARKET TREND ANALYSIS

Weekly Energy Market Updates by Region - Archive


Issue week: April 2nd, 2020  (Wk 14)


POWER MARKETS

Chart1_Energy_Market_Intelligence_Commercial


WEST In the spot market, the destruction of demand from the coronavirus has suppressed both Day Ahead and Real Time prices. During the week of March 23-29, load dropped by an average of 1,725 MW per day, which correlates to an 8% drop in demand from the period of March 1-22. In the term market, prices for the balance of the year continue to trend lower as 2021 and beyond remain flat..

ERCOT  Term prices climbed this week, mainly in the front of the curve, because of a surge in price for the NG strip for calendar year 2021. Real-time prices have been moderate this week, with little, if any, ORDC to speak of. Even the basis in the West Load Zone has cleared only in the mid-$10s/MWh. However, wind generation is expected to be lower than normal over the next week, as temperatures are projected to be above normal.

EAST Peak demand unsurprisingly decreased across ISOs in the second half of March. NYISO is down by 7.5%, PJM is down by 6.6%, and ISO-NE is down by 4.9%. Spot prices remain soft across the main trading hubs. Meanwhile, in the forward market, the 3-month package has moved down by $1-$2/MWh since the beginning of March, but the 6-to-12-month term has not moved much.


NATURAL GAS 

The EIA reported Thursday morning that, for the week ending March 27, U.S. inven-tories decreased by 19 Bcf, validating the expected range of 10-35 Bcf. Total stockpiles now stand at 1,986 Bcf, up by 76.8% from a year ago and 17.2% above the five-year average for the same week.

Without a bullish draw from the storage report or colder weather to help demand, NY-MEX monthly-contract prices fell from the front month out to June 2022. As of 1:00 p.m. PDT, May contracts sank to a weighted average of $1.556/MMBtu, $0.031/MMBtu below Wednesday’s close. One support mechanism to keep prices from falling further could be the jump in the price of oil that accompanied Pres-ident Trump’s announcement that he expects Russia and Saudi Arabia to cut produc-tion of the commodity amid their ongoing price war.


Chart1

Map1

Map2

Chart2


Chart4_Energy_Market_Intelligence_Commercial


PLAYING OFFENSE AND DEFENSE DURING MARKET TURMOIL

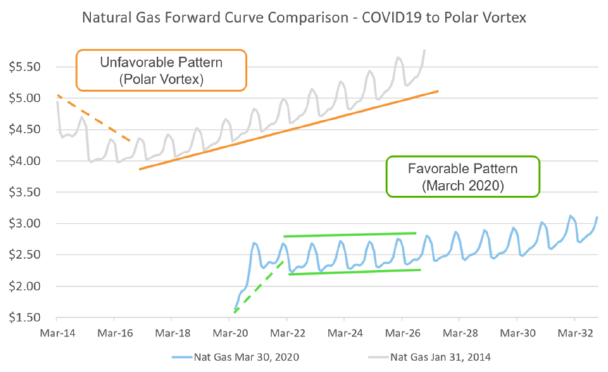
Current market conditions are obviously among the most challenging seen in a long time in light of the combination of higher and broad-based market volatility, liquidity challenges across many markets and sectors, and a deep sense that conditions will worsen before they improve. Such a foreboding economic atmosphere can naturally trigger a very defensive response from investors, but those same conditions can cre-ate opportunities to play some offense at the same time, too. Market players shrewd enough to see through the fog and go after them can reap some nice long-term bene-fits. A comparison of the NYMEX Henry Hub forward price curves for natural gas dur-ing the Polar Vortex in the winter of 2014 and today’s COVID-19 crisis (shown in the chart below) helps illustrate this point.

During that extreme-weather event six years ago, near-term forward prices pushed sharply higher than prices 1-3 years out before resuming their historically normal up-ward slope for several years forward. This pattern can yield missed opportunities in two ways. First, although conventional wisdom might be to chase rising near-term prices to lock in a larger share and avoid future risk, those who do so often overlook better price opportunities when near-term prices settle down. Second, although buyers might think to extend the time horizon for locking prices when forwards carry a dis-count (thereby reducing the average price paid over that period), they frequently fore-go longer-term opportunities by doing that.

The current curve is noticeably different from the one during the Polar Vortex but con-tains its own potential traps. Because near-term forwards are sharply lower than long-er-term forwards, one might see that seemingly steep forward premium for the first two years and instinctively want to avoid locking in those longer-term prices because they are “too high,” but this thinking is often misguided. Typically, the premium is so steep because the bottom fell out of the very front end of the forward curve, making it more likely that it will rise over time to more historically normal levels, as opposed to the back part of the curve coming down to meet it. Furthermore, the back part of the curve also tends to shift higher under those conditions. Therefore, as the difference between shorter- and longer-term prices narrows, prices rise across the board.

The current chaos features the best of both worlds, where not only nominal prices but also forward premiums are historically low. Consequently, a case can be made for taking larger and longer-term fixed-price positions. Making smart strategic decisions during the current volatility may prove quite beneficial when it ultimately passes.


Previous Weekly Market Reports: Archive


Disclaimer: This report is for informational purposes only and all actions and judgments taken in response to it are recipient’s sole responsibility. Champion Energy Services does not guaranty its accuracy. This reports is provided ‘as is’. Champion Energy Services makes no expressed or implied representations or warranties of any kind. Except as otherwise indicated in this report, this report shall remain the sole and exclusive property of Champion Energy Services and shall be free from any claim or right, license, title or interest. Champion Energy Services shall not be liable for any direct, indirect, incidental, consequential, special or exemplary damages or lost profit resulting from this report.