banner_market_intelligence_1440x441

MARKET TREND ANALYSIS

Weekly Energy Market Updates by Region-Archive


Issue week: October 1st, 2020  (Wk 40)


POWER MARKETS

Chart1_Energy_Market_Intelligence_Commercial


WEST Surging demand due to the scorching heat throughout California, combined with limited hydro production in the Pacific Northwest, has jacked up prices during the nightly ramp this week. Temperatures are beginning to drop, so demand should normalize. Nonetheless, upside risks in the nightly ramp remain as thermal and nuclear facilities enter maintenance season, decreasing the amount of flexible supply available. In the term market, prices for the balance of this year remain elevated, but CY2021 and beyond continue to decline on falling NYMEX prices.

ERCOT  After the first cold front of the year moved in last weekend, peak loads have decreased into the mid-to-upper 40,000-MW range for the week. With ample generation reserves available, RT prices have averaged only around $15/MWh across all zones. Forward prices have also retreated from last week after Vistra did not announce further coal retirements in ERCOT during its recent investor call. Consequently, July/August 2021 and 2022 summer on-peak prices sold off by approximately $5/MWh. In conjunction with falling NG prices, this drop has dragged the CY21 and CY22 7x24 strips down by $1-$1.50/MWh, whereas outer-year CY strips are down by only $0.25-$0.50/MWh.

EAST Day Ahead basis in New England picked up at the end of September because of a binding constraint on the West-East interface due to a planned outage of the Phase II interconnection, which transmits power imported from Hydro-Quebec. In Connecticut and Vermont, Day Ahead prices were below those of Mass Hub by as much as $17/MWh during a few on-peak hours, whereas the eastern zones were higher by as much as $13/MWh. In WCMA, Day Ahead prices were also below its neighbor Mass Hub, albeit only by as much as $1.50/MWh.

Chart1

Map1

Map2

Chart2


Chart4_Energy_Market_Intelligence_Commercial


GAS MARKET FAR FROM IDEAL

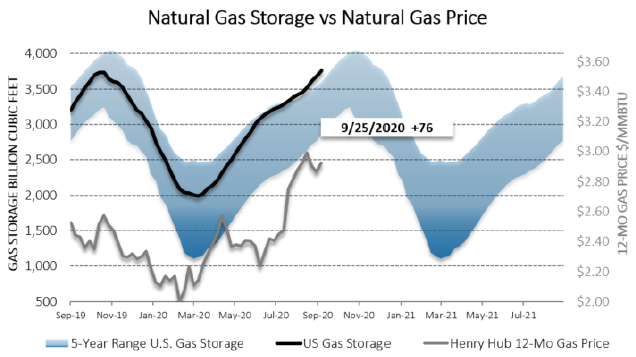
Many are familiar with the spectacular drop of oil prices into negative territory this year (shown in the lower-left chart below). Not so well known is the domino effect that their fall kicked off through the other energy markets, especially natural gas. This year, natural gas has traded at prices not seen since 2016. its fun-damental market dynamics started to change when the world locked down to protect itself from the coronavirus pandemic, for with the lock-down came fewer travelers. Fewer travelers meant lower demand for oil. Lower demand for oil, in addition to a brief price war between Russia and Saudi Arabia, precipitated a plunge in oil prices. Anemic oil prices meant less revenue for oil and gas companies. Less revenue meant less spending on exploration (exemplified by the shrinking rig count illustrated in the chart above on the lower right). Finally, reduced explora-tion meant reduced oil and gas production. As evidenced by the recent rise in exports of liquefied natural gas (LNG), demand for natural gas has started to pick up, but production has stayed flat. The top chart below shows that oil and gas producers simply lack the revenues to justify the capital expenditures needed to continue growing at the pace at which they were growing prior to the lockdowns. This combination of tighter supply and increasing demand has injected into the natural gas market a degree of volatility not seen for some time. Indeed, gas prices shot to $2.66/MMBtu by August 28, lost 31% by September 22, and developed whiplash after rocketing back up by nearly 40% by September 29! Gas producers will not be able to ramp up production until they have the cash to do so. Unfortunately, because lenders and investors have soured on their prospects, that might take a while, so the strong yet vol-atile gas market is likely not only to continue but also to have an effect on power prices.


Previous Weekly Market Reports: Archive


Disclaimer: This report is for informational purposes only and all actions and judgments taken in response to it are recipient’s sole responsibility. Champion Energy Services does not guaranty its accuracy. This reports is provided ‘as is’. Champion Energy Services makes no expressed or implied representations or warranties of any kind. Except as otherwise indicated in this report, this report shall remain the sole and exclusive property of Champion Energy Services and shall be free from any claim or right, license, title or interest. Champion Energy Services shall not be liable for any direct, indirect, incidental, consequential, special or exemplary damages or lost profit resulting from this report.