banner_market_intelligence_1440x441

MARKET TREND ANALYSIS

Weekly Energy Market Updates by Region - Archive


Issue week: December 17th, 2020  (Wk 51)


POWER MARKETS

Chart1_Energy_Market_Intelligence_Commercial


WEST In the index market, above-average temperatures and strong hydro gen-eration have limited the volatility of Day Ahead prices throughout December. In the term market, Calendar Year 2021 remains strong because of very high forward prices in the Palo Verde curve for the neighboring Desert Southwest.

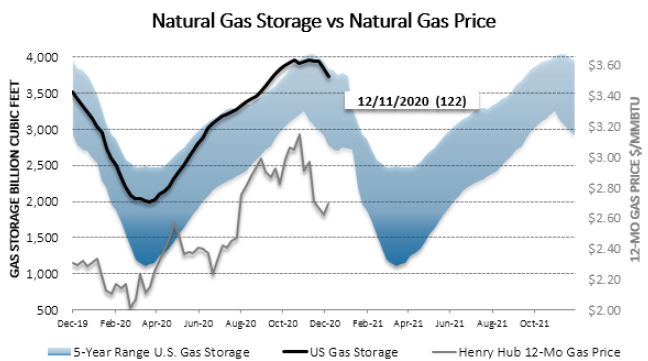
ERCOT  Whereas term natural gas prices have risen by a nickel or so out the curve, term power prices have been flat to down a bit from last week, but the big news this week is the release of the Capacity, Demand, and Reserves report. Basically, given the projected onset of new renewable generation, ER-COT has called for nearly an 80% increase in the reserve margin over the next four years. Accordingly, the reaction in term prices has not been supportive. Real-time prices have settled in the mid-$20s/MWh for most of the week, ex-cept the morning-ramp hours, which have recorded some triple-digit prints at the various load zones. Consequently, the ORDC adder for the week has been negligible.

EAST In the aftermath of Winter Storm Gail in the Northeast, RT prices have skyrocketed to year-to-date highs over the past two days: NYISO’s Hudson Valley reached $188/MWh last evening, and ISO-NE’s Mass Hub rose to $148/MWh this afternoon. Prices in the Northeast are poised to remain bullish through the storm.

Chart1

Map1

Map2

Chart2


Chart4_Energy_Market_Intelligence_Commercial


MOVING ON AFTER THE YEAR OF COVID

Despite some moments of hope, the economy never real-ly managed to free itself from the clutches of the pandem-ic in 2020. The chart below from the U.S. Energy Infor-mation Administration shows that, for example, although summertime electricity consumption largely resembled that of years past as reopenings helped businesses ap-proach normal again, with the change of seasons came a resurgence of the coronavirus and a major drop in usage similar to that of springtime. Indeed, September usage in the U.S. decreased by 7.3 percent from September 2019, and U.S. energy demand is projected to remain below the five-year average by 1.22 percent in 2021.

However, much of that drop is expected to be restricted to the first half of the year as vaccinations ramp up and nor-malcy starts to return to the country. Also encouraging are expectations of further growth in renewable energy. In-vestment in these resources was not as bad as feared early in the pandemic , and incoming President Biden has made clear his wish for much more of it. Although some foresee a slight recovery for coal due to expectations of higher natural gas prices and a general increase in power usage in 2021, the next four years should mean good things for renewables and their related emergent technol-ogies, such as battery storage to make them even more appealing.


Previous Weekly Market Reports: Archive


Disclaimer: This report is for informational purposes only and all actions and judgments taken in response to it are recipient’s sole responsibility. Champion Energy Services does not guaranty its accuracy. This reports is provided ‘as is’. Champion Energy Services makes no expressed or implied representations or warranties of any kind. Except as otherwise indicated in this report, this report shall remain the sole and exclusive property of Champion Energy Services and shall be free from any claim or right, license, title or interest. Champion Energy Services shall not be liable for any direct, indirect, incidental, consequential, special or exemplary damages or lost profit resulting from this report.