POWER MARKETS
WEST Amid potentially record-shattering temperatures in the Pacific Northwest next week, demand is poised to hit record levels of its own to yield very high Day Ahead prices in Mid-C. Earlier this week, the Q3 2021 forward curve for Mid-C rose with news of the coming heatwave. In contrast, after the 16-to-20-day forecast for the entire West Coast was revised in a cooler direction today, the Q3 forward curve for all trading hubs in the West fell by approximately $25/MWh.
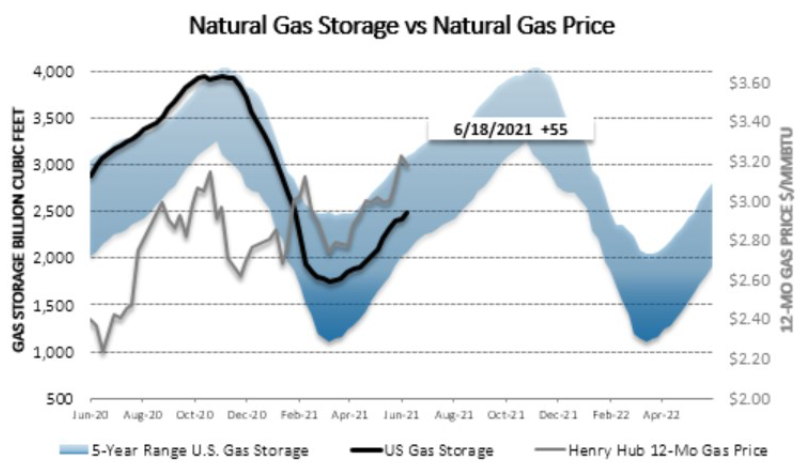
ERCOT Real-time prices have been mixed this week, nudged up a bit by some decent cooling load in key hours. Nonetheless, real-time MTD averages are between the high $30s/MWh and low $40s/MWh and well above the $25/MWh and $15/MWh logged for June 2019 and June 2020, respectively. The ORDC adder for the month has dropped just under $3.00/MWh, also higher than in prior years. Bolstered by rising heat rates and natural gas prices, term prices have climbed higher this week in all zones. However, the endurance of this trend will soon be tested, for the next two weeks are called to be cooler than normal across the state. Moreover, the impact of droughts in southern Texas is near zero after the abundant spring rainfall.
EAST Relative to recent weeks, prices are mostly steady this week. The Day Ahead aver-age in MISO’s Indiana Hub has come down to $31/MWh, and its Real time average is almost $5/MWh lower. Similarly, the Day Ahead average in ISO-NE’s Mass Hub is $33/MWh, nearly $6/MWh higher than the Real Time average. In NYISO, both Hudson Valley and NYC are printing Day Ahead averages of $32/MWh and Real time averages around $2/MWh lower. In PJM’s West Hub, Day Ahead is averaging $28/MWh while Real time is averaging $2/MWh less.