banner_market_intelligence_1440x441

MARKET TREND ANALYSIS

Weekly Energy Market Updates by Region - Archive


Issue week: August 12th, 2021  (Wk 32)


POWER MARKETS

Chart1_Energy_Market_Intelligence_Commercial


WEST  Throughout August, Day Ahead prices in SP15 and Mid-C have averaged $68/MWh and $85/MWh, respectively. The extremely dry winter and spring have depleted the water in reservoirs across California to dangerously low levels. After the Lake Oroville Reservoir sank below the threshold of 642 feet above mean sea level, the 644 MW Edward Hyatt Power Plant located there was shut down for the first time last week, and other large reservoirs face similar issues, further jeopardizing hydro generation during the nightly ramp over the rest of the month.

ERCOT  Real-time prices for the first half of the month have been quite moder-ate, all load zones settling just under $35/MWh. The ORDC adder has also been minimal. Term heat rates have moved inversely with term gas this week, yielding slightly lower term prices out the curve. Apparently, Tropical Storm Fred will not have a material impact on weather—and prices—in Texas.

EAST Intense heat over the last week has raised demand and triggered CORE alerts in all Northeast and Midwest ISOs on several days. Data show that NYI-SO preliminarily set its system peak for the summer thus far just under 30 GW yesterday. Both Day Ahead and Real Time prices are up from last week with significant DART spreads across all PJM zones. In Indiana Hub, the Day Ahead average is more than $10/MWh above the Real Time average so far this week.

Chart1

Map1

Map2

Chart2


U.S. NATURAL GAS EXPORTS EXPLODE

The U.S. natural gas sector has enjoyed quite the boom this year. The U.S. Energy Information Administration (EIA) reported last month that, in June, pipe-line exports to Mexico to support that country’s industrial base and electricity generation peaked at 7.4 Bcf/day and exceeded the monthly average of the previous five years by 44%. Furthermore, overseas shipments of U.S. liquefied natural gas (LNG) hit record levels in the first half of 2021 to average nearly 10 Bcf/day after benefiting from relative misfortunes in Asia and Europe.
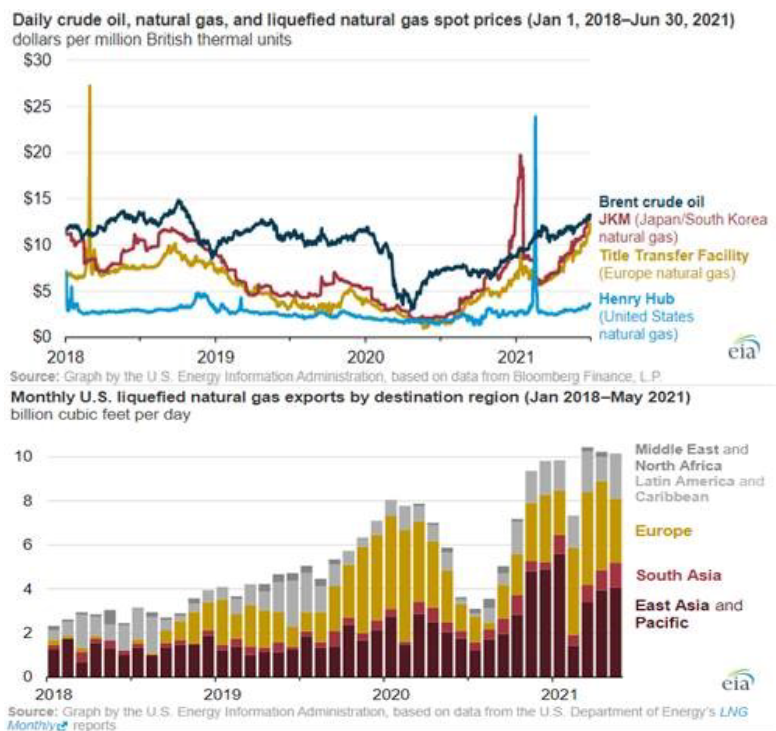
Not only did abnormally cold winter weather in both of those continents eat into their respective inventories, but an unusually warm spring in Europe, which places great emphasis on renewable energy, also raised demand for natural gas for backup generation to keep its grids balanced. As the graph from the EIA below makes clear, the resultant spike in spot LNG demand in Asia and Europe has raised regional natural gas prices so much that U.S. (Henry Hub) natural gas has become much more economically attractive.
Given the major investments by U.S. producers to expand export capacity over the last five years, these strides were not unexpected. Indeed, exports have accounted for more than 15% of domestic production so far in 2021, contributing to price increases for the commodity in the States.
Ironically, these developments are a testament to the ongoing need for natural gas as the unsung hero enabling global efforts to decarbonize, for it continues to play an outsize role in counterbalancing the variable output from wind and solar generation facilities. Although key advancements have been made in large-scale battery storage technology, natural gas remains indispensable to global energy security for the time being.

Chart4_Energy_Market_Intelligence_Commercial


Previous Weekly Market Reports: Archive


Disclaimer: This report is for informational purposes only and all actions and judgments taken in response to it are recipient’s sole responsibility. Champion Energy Services does not guaranty its accuracy. This reports is provided ‘as is’. Champion Energy Services makes no expressed or implied representations or warranties of any kind. Except as otherwise indicated in this report, this report shall remain the sole and exclusive property of Champion Energy Services and shall be free from any claim or right, license, title or interest. Champion Energy Services shall not be liable for any direct, indirect, incidental, consequential, special or exemplary damages or lost profit resulting from this report.