banner_market_intelligence_1440x441

MARKET TREND ANALYSIS

Weekly Energy Market Updates by Region - Archive


Issue week: February 4th, 2021  (Wk 5)


POWER MARKETS

Chart1_Energy_Market_Intelligence_Commercial


WESTCalifornia’s first major storm of the year last week increased snowpack in the Golden State by 28% to 68% of normal, portending strong hydro generation for the summer. Meanwhile, CAISO’s proposed increase of the import offer cap from $1,000/MWh to $2,000/MWh starting in June is likely to increase the amount of imports to CAISO, needed for system reliability during peak load conditions because of regional emphasis on intermittent renewable generation among new facilities being built.

ERCOT  Thanks to the mild weather across the state over the past week, 7x24 real-time prices are averaging around only $16/MWh, approximately $5/MWh below last week. However, spot prices should get a bump with the cold front expected to move into the region in the middle of next week. Peak prices for next week are currently in the upper $30s/MWh. Term prices in the front of the curve continue their rise from the bottom as natural gas prices continue to climb with forecasts of colder weather along the East Coast. Prompt 12-month 7x24 prices are up from last week by approximately $1.50/MWh at $31/MWh, but the outer CY strips are relatively unchanged.

EAST Ironically, this week’s cold weather has turned up the heat in New England’s and New York’s ISOs. In ISO-NE’s Mass Hub, Day Ahead and Real Time are averag-ing a whopping $80/MWh and $95/MWh, respectively. Over in NYISO’s Zone J (NYC), the averages are $68/MWh and $75/MWh. Moreover, evening prices across zones in NYISO blew past $600/MWh last Friday because of not only the severe cold but also localized congestion.

Chart1

Map1

Map2

Chart2


Chart4_Energy_Market_Intelligence_Commercial


PANDEMIC NOT SLOWING THE GREEN REVOLUTION ANYTIME SOON

As the pandemic introduced multiple unforeseen challenges to global markets last year, many companies had to scramble to adapt to a business climate changing constantly. One might think that, amid the economic turbulence, they would sacrifice lofty priorities such as renewable energy, but the numbers prove otherwise.

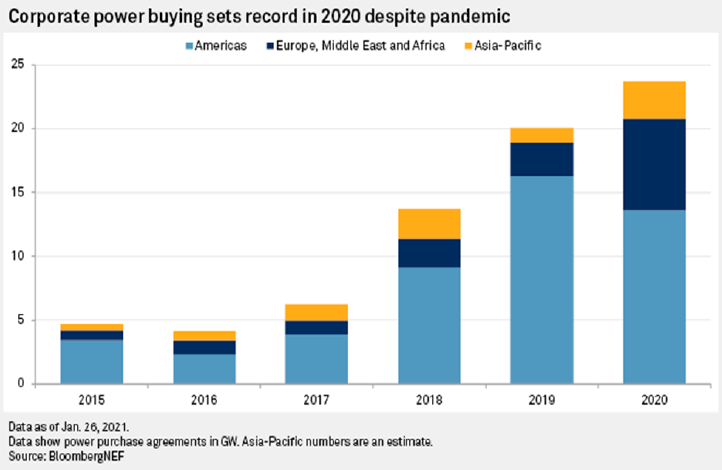
Camilla Naschert of S&P Global Market Intelligence reported last week that, in 2020, more than 130 corporations spanning various sectors around the world entered into their own power purchase agreements to procure a record total of 23.7 GW of wind and solar power. Indeed, the chart above from research firm BloombergNEF shows that, although corporations in the Western Hemisphere did purchase less green electricity than in 2019, those in the Eastern Hemisphere actually recorded their largest renewable-energy purchases of the last six years by far.

The resilience of this push toward renewable energy demonstrates the power of stakeholder emphasis on sustainability. Because customers and employees, in addition to shareholders, are placing so much value on sustainability, management and directors are increasingly recognizing the need to reduce their carbon emissions and footprint. Consequently, corporate initiatives to become carbon-neutral continue to spread. As Kyle Harrison of BloombergNEF observed, “To not only maintain, but grow, the clean energy procure-ment market under these conditions is a testament to how high sustainability is on many corporations’ agendas.” Moreover, companies’ clean-energy commitments are poised to remain big for the foreseeable future. Naschert reported that, last year, approximately 65 new companies joined the RE100 pledge to offset 100% of their electricity usage with clean energy, which, according to BloombergNEF, will require 93 GW of additional renewable-energy purchase contracts. Clearly, the current strength of the market for renewables during these trying times signals even better times ahead once the broader economic challenges have eased.


Previous Weekly Market Reports: Archive


Disclaimer: This report is for informational purposes only and all actions and judgments taken in response to it are recipient’s sole responsibility. Champion Energy Services does not guaranty its accuracy. This reports is provided ‘as is’. Champion Energy Services makes no expressed or implied representations or warranties of any kind. Except as otherwise indicated in this report, this report shall remain the sole and exclusive property of Champion Energy Services and shall be free from any claim or right, license, title or interest. Champion Energy Services shall not be liable for any direct, indirect, incidental, consequential, special or exemplary damages or lost profit resulting from this report.