banner_market_intelligence_1440x441

MARKET TREND ANALYSIS

Weekly Energy Market Updates by Region - Archive


Issue week: February 11th, 2021  (Wk 6)


POWER MARKETS

Chart1_Energy_Market_Intelligence_Commercial


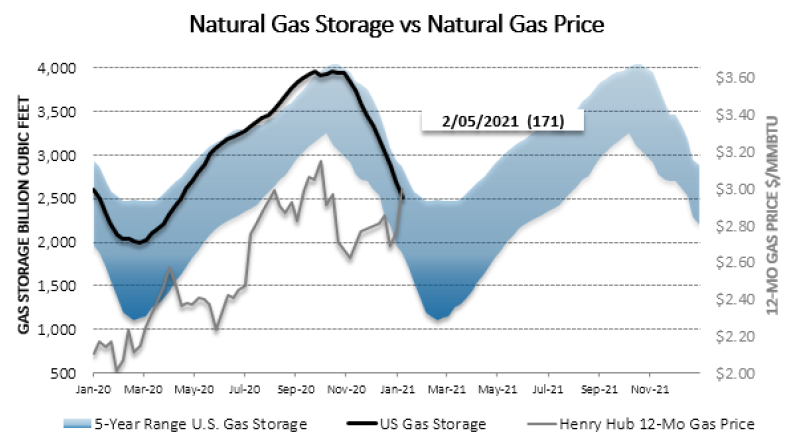
WESTHistorically strong natural gas stockpiles in California and the Pacific Northwest have kept index prices relatively soft. So far in February, Day Ahead prices have averaged around $31/MWh in CAISO and $24/MWh in Mid-C. However, in conjunction with an equipment failure on the West Coast pipeline reducing the amount of natural gas that can reach the Pacific Northwest, cold weather projected for that region could drive index prices higher over the weekend.

ERCOT  The MTD average for real-time prices has settled in the mid $30s/MWh with the recent cold weather, and the persistent strength of natural gas prices has given a boost to term prices. The ORDC adder has also risen near $0.30/MWh, up from only a nickel a month ago. The market has responded to forecasts of a sharp blast of Arctic air sweeping through Texas, which should plunge temperatures into the low 20s on Monday and Tuesday. On-peak prices for next week are currently trading at $800/MWh as load is projected to approach record highs of just more than 70,000 MWh amid possibili-ties of decreased generation from reductions in gas supply due to potential shut-ins, potential curtailment of wind output in the West Load Zone, and depressed solar output due to the cloudy, wintry conditions.

EAST While the weather in ISO-NE and NYISO has been cold, prices have been hot. In ISO-NE’s Mass Hub, Day Ahead has averaged $92/MWh this week while Real Time has averaged $85/MWh. In NYISO’s Hudson Valley, the Day Ahead and Real Time averag-es are $63/MWh and $49/MWh, respectively. Prices at the main hubs in PJM and MISO have held steady despite the cold front in the East.

Chart1

Map1

Map2

Chart2


Chart4_Energy_Market_Intelligence_Commercial


THE CHANGE OF WINDS IN U.S. ENERGY

The growth of wind power in the U.S. has seemed unstoppable over the last couple of decades. Wind turbines even eclipsed hydropower as the largest source of renewable power in 2019 and actually showed no signs of slowdown in 2020. As shown in the graph above from the U.S. Energy Information Administration, the previous one-day wind-generation record of 1.42 million MWh was broken several times in the last two months of last year and absolutely shattered by 340,000 MWh on December 23.

However, the gusts are not expected to last forever and may already be dying down. As solar construction costs continue to plummet, solar power has taken some of wind’s market share. Furthermore, the production tax credit for constructing wind farms is expected to phase out after 2024. Consequently, although construction costs for adding wind capacity have also dropped significantly since the turn of the century, the likelihood of new wind power installations may decline sharply, barring another extension of the credit.

President Biden has announced his plan to invest $2 trillion over the next four years to grow the country’s green-energy profile, but the fraction of that earmarked for wind power has not yet been finalized. Without new policies or advocacy to encourage its continued growth, the air could be very still before long.


Previous Weekly Market Reports: Archive


Disclaimer: This report is for informational purposes only and all actions and judgments taken in response to it are recipient’s sole responsibility. Champion Energy Services does not guaranty its accuracy. This reports is provided ‘as is’. Champion Energy Services makes no expressed or implied representations or warranties of any kind. Except as otherwise indicated in this report, this report shall remain the sole and exclusive property of Champion Energy Services and shall be free from any claim or right, license, title or interest. Champion Energy Services shall not be liable for any direct, indirect, incidental, consequential, special or exemplary damages or lost profit resulting from this report.