banner_market_intelligence_1440x441

MARKET TREND ANALYSIS

Weekly Energy Market Updates by Region


Issue week: February 3rd, 2022  (Wk 5)


POWER MARKETS

Chart1_Energy_Market_Intelligence_Commercial


WEST  As relatively warm weather limited both residential and commercial demand for natural gas throughout January, Day Ahead prices dropped in the last two weeks of last month. In the forward market, the bitter cold spanning from Texas to the Northeast this week has pushed the NYMEX forward curve up over the past few days to lift the BY2022 forward curve in CAISO and Mid-C.

ERCOT  Extreme short-term volatility has been the theme of this week. After reaching a high of $150/MWh, prices for 7x24 Bal-February have since retreated to $80/MWh as the market continues to process the impact of Winter Storm Landon. Although wind generation in West Texas has not yet been hindered by any major snow or icing issues, the brunt of the cold is not expected until Friday morning, when peak load is projected to surpass last year’s record winter peak of 70,000 MW by more than 4,000 MW. Consequently, real-time prices could still swing wildly tomorrow; peak prices for Friday are currently around $300/MWh. Big moves in natural gas prices due to the wild weather have made forward prices jump around as well. For instance, the 12-month prompt 7x24 strip was up by approximately $10/MWh from last week at $57/MWh before receding to $53/MWh. Outer-year 12-month strips were also $1-$2.50/MWh higher than last week.

EAST Prices keep rising in ISO-NE and NYISO amid the freezing weather but have held steady in MISO and PJM. In Mass Hub and Hudson Valley, Day Ahead is averaging $185/MWh and $164/MWh, respectively. Meanwhile, the Real Time averages in both of those regions are almost $200/MWh and $175/MWh, higher than last week by $40/MWh and $10/MWh, respectively. Meanwhile, both Day Ahead and Real Time are settling around $50-$80/MWh in the main hubs throughout MISO and PJM.


NATURAL GAS 

The EIA reported Thursday morning that, for the week ending January 28, U.S. inventories decreased by 268 Bcf, 17 Bcf less than the projected withdrawal of 285 Bcf. Total stockpiles now stand at 2,323 Bcf, down by 14.5% from a year ago and 5.8% below the five-year average for the same week.

In its first week as the prompt month, the NYMEX Henry Hub contract for March has exhibited plenty of volatility as weather models have changed rapidly. It closed yesterday at $5.501/MMBtu, $0.750/MMBtu more than on Tuesday, but backed off sharply today, finishing at $4.888/MMBtu. Recent cold weather in Texas has triggered PTSD from last year’s Winter Storm Uri and fostered uncertainty that has applied upward pressure on prices.


Chart1

Map1

Map2

Chart2


Map1_Energy_Market_Intelligence_Commercial


NO SUCH THING AS “TOO MUCH” ENERGY STORAGE

A common refrain in the debate over how to meet future global energy needs cleanly is the importance of energy storage. Indeed, the International Energy Agency (IEA) declared last November in its Energy Storage tracking report that, to realize its Net Zero Emissions by 2050 Scenario, worldwide energy storage capacity needs to grow by approximately 38% annually between now and then.

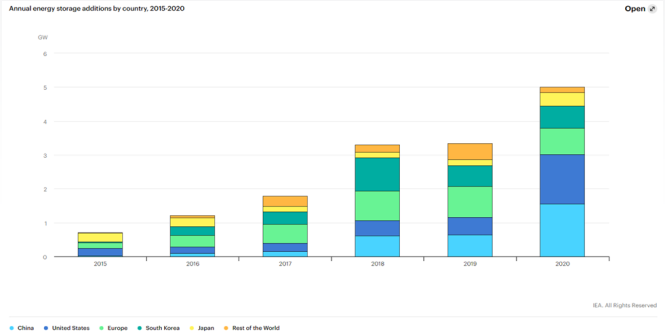
Not surprisingly, that gap is being bridged largely with battery technology. The graph below from the IEA illustrates that, in 2020 alone, global battery capacity increased by 5 GW to a total of 17 GW. China and the U.S. led the way in energy storage additions that year and have not stopped there. China is planning to install more than 30 GW of further storage infrastructure by 2025, and the U.S., through the Better Energy Storage Technology Act, has earmarked more than $1 billion over five years to support development of the technology.

Chart4_Energy_Market_Intelligence_Commercial

Even individual states have emphasized storage solutions in their respective green-energy strategies. The National Conference of State Legislatures notes seven states whose procurement targets require the integration of storage technologies. Most recently, for example, Virginia enacted legislation mandating that its utilities acquire a combined 3,100 MW of new energy storage by the end of 2035. Moreover, motivating renewable generation, which absolutely needs to be coupled with storage options to offset its intermittency problem, is not the only priority for some states’ embrace of energy storage; after the havoc wreaked by Winter Storm Uri on its grid a year ago, Texas is considering such innovations for short-term grid reliability during emergencies.

Of course, the attention that batteries receive in this conversation should not overshadow the contributions of other, more time-tested energy-storing technologies, such as pumped hydroelectric capacity, compressed air, flywheels, and thermal energy storage. In fact, the U.S. Department of Energy observed that, as recently as March 2018, 94% of all stored energy capacity in the U.S. was in the form of pumped hydroelectric capacity. Certainly, any and all methods to store energy will be needed and welcome to achieve a greener energy future in the most economically sound way.


Previous Weekly Market Reports: Archive


Disclaimer: This report is for informational purposes only and all actions and judgments taken in response to it are recipient’s sole responsibility. Champion Energy Services does not guaranty its accuracy. This reports is provided ‘as is’. Champion Energy Services makes no expressed or implied representations or warranties of any kind. Except as otherwise indicated in this report, this report shall remain the sole and exclusive property of Champion Energy Services and shall be free from any claim or right, license, title or interest. Champion Energy Services shall not be liable for any direct, indirect, incidental, consequential, special or exemplary damages or lost profit resulting from this report.