banner_market_intelligence_1440x441

MARKET TREND ANALYSIS

Weekly Energy Market Updates by Region


Issue week: March 31st, 2022  (Wk 13)


POWER MARKETS

Chart1_Energy_Market_Intelligence_Commercial


WEST  Throughout March, Day Ahead prices averaged around $41.50/MWh in SP15 and $33.75/MWh in Mid-C. The lower figure in Mid-C was driven by a combination of strong hydro generation and light demand. In the forward market, prices continue to swell on the back of a strong rise in the NYMEX forward market, which has persisted throughout the month.

ERCOT  Term prices continue to rise throughout the curve, buoyed again by surging natural gas prices. Indeed, CY 2023 in the North Load Zone has increased by $10-$15/MWh since the beginning of February. In contrast, real-time prices have been relatively immune to the same influence; depending on the zone, March prices have averaged in the mid-$30s/MWh. Spot prices are projected to reach the high $50s/MWh in April as maintenance season begins while output from wind units varies. The ORDC adder for March is minimal as well.

EAST After a three-week lull, both Day Ahead and Real Time have picked back up, especially in New York and New England. The latest storm to hit the Northeast not only raised demand beyond expectations but also cut exports, forcing the deployment of hydro assets with an insufficient number of oil-fueled units in the supply stack. While Day Ahead prices have jumped by roughly $30/MWh from last week, Real Time is up by $52/MWh on average.


NATURAL GAS 

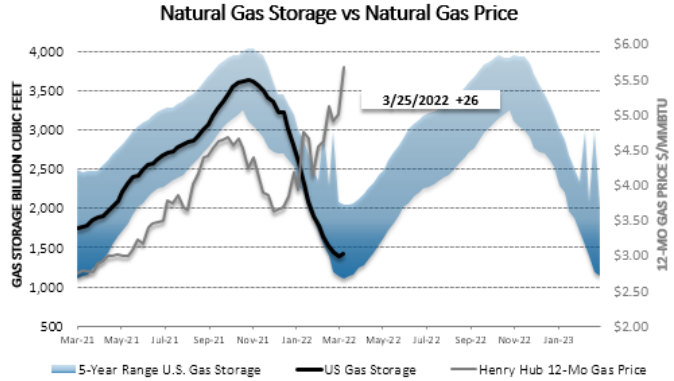
The EIA reported Thursday morning that, for the week ending March 25, U.S. inventories increased by 26 Bcf, not much less than the anticipated deposit of 28 Bcf. Total stockpiles now stand at 1,415 Bcf, down by 29.7% from a year ago and 14.7% below the five-year average for the same week.

The new NYMEX Henry Hub prompt month of May closed today at $5.642/MMBtu, $0.037/MMBtu higher than yesterday but roughly similar to last week‘s final of $5.611/MMBtu. At one point today, it traded within striking distance of $6/MMBtu at $5.832/MMBtu. As the new month begins tomorrow, the May strip is at its all-time high.

Map1_Energy_Market_Intelligence_Commercial


Chart1

Map1


Previous Weekly Market Reports: Archive


Disclaimer: This report is for informational purposes only and all actions and judgments taken in response to it are recipient’s sole responsibility. Champion Energy Services does not guaranty its accuracy. This reports is provided ‘as is’. Champion Energy Services makes no expressed or implied representations or warranties of any kind. Except as otherwise indicated in this report, this report shall remain the sole and exclusive property of Champion Energy Services and shall be free from any claim or right, license, title or interest. Champion Energy Services shall not be liable for any direct, indirect, incidental, consequential, special or exemplary damages or lost profit resulting from this report.